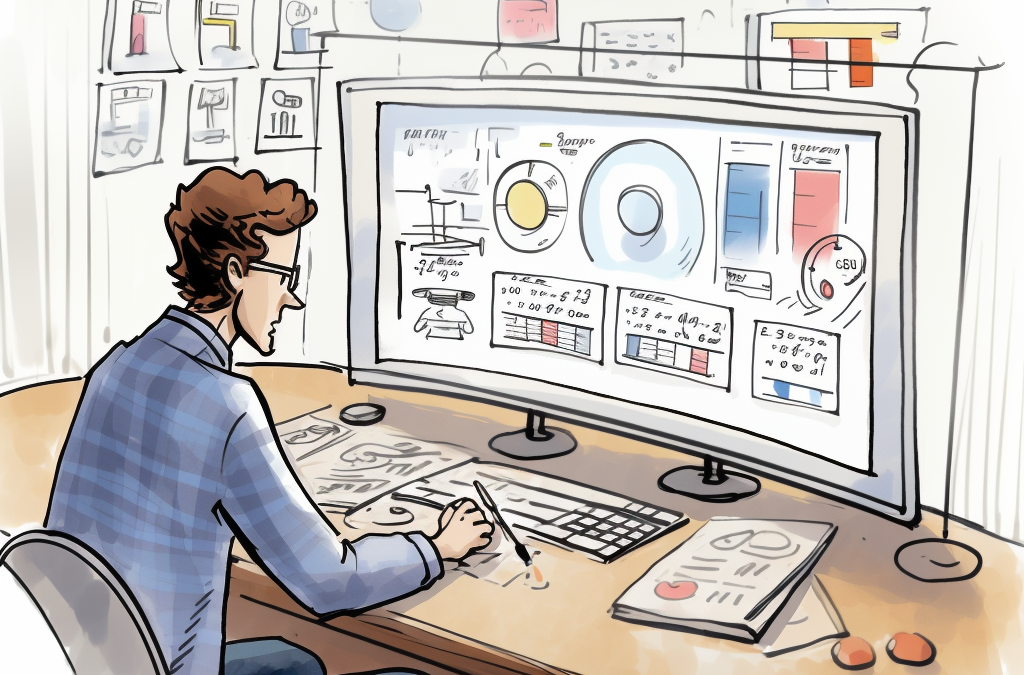
Usability testing is the evaluation of a product or interface by testing it with end users to identify any usability issues and improve overall user experience. The user experience of a piece of software is wholly down to the design of the interface. How a user perceives and operates the software is make or break. If the user is unable to readily use the software to achieve their goals, then arguably the development project has failed and any other considerations are moot.
Interfaces should be functional, intuitive and easy to use. How do we make this judgement? We have to move beyond subjective assessments. To unlock the true potential of usability testing we need to harness quantitative data to measure an interface’s effectiveness.
What is Usability Testing?
Much like User Acceptance Testing (UAT) verifies that software fulfills its intended purpose, Usability Testing ensures that an interface is more than just aesthetically pleasing—it must be functional, efficient, and accessible. Typically a small set of target users are assigned tasks to undertake. An observer will monitor the behaviour of the test group without offering any support or guidance. This testing is typically conducted where both tester and observer are physically located together. Alternatively this can achieved remotely with the tester’s voice, facial expressions and screen activity recorded by automated software. This data can then be analysed at a later date.
How do we Quantify Usability?
What metrics can we gather to show Usability? Key metrics (amongst many) are:
- Defining Effectiveness: Does the interface do what it’s supposed to do? Measure this through task success rates and error rates.
- Assessing Efficiency: How long does a task take? What’s the click count to task completion? These figures tell us how efficiently users can navigate the interface.
- Evaluating Satisfaction: How do users feel about the interface? Utilize scales like SUS or CSUQ to convert subjective satisfaction into quantitative data.
- Learning Curve: How quickly do users get up to speed with the interface? Look at the time it takes to complete tasks initially versus after some practice.
To achieve meaningful results we must define clear tasks that lend themselves to quantifiable outcomes. Use tools that accurately record user interactions without being obtrusive to ensure the user responses are as authentic as possible.
Analysing the Data
All the data gathered in the test phase now needs to be collated. Alongside the quantitative data like error rates and timings we still need the qualitative data such as user comments and feedback.
Standard statistical analysis of the data can now highlight issues. For example:
- Look at the success rate of tasks. Determine what percentage of users were able to complete each task without assistance. If certain tasks have low success rates, they may require more attention in your design.
- Identify common errors and the points at which users encounter them. Analyzing errors can help you pinpoint areas of the interface that may be confusing or not working as intended.
- Assess how long users take to complete tasks. Tasks that take significantly longer than expected may indicate design elements that are not intuitive or efficient.
We shouldn’t though overlook the accompanying qualitative data. This provides a narrative behind the numbers and will often contextualise the why behind the what.
The Numbers Matter
By quantifying our usability testing we are making decisions and shaping our application interfaces based on solid data not hunches. This methodology not only enhances the user experience, it fortifies it with empirical evidence.
Usability testing with numbers gives us a clear picture of how well an interface works. This way, we’re not just guessing; we’re making choices based on what we actually see. As technology gets more complicated, it’s even more important to stick to the facts and figures. They help us make things that aren’t just nice to look at, but also a pleasure to use.

